

get the right results from your clinical study with help from our experienced immunology team Dear Colleague, Anyone with experience in designing cellular immune response assays will be aware of the multitude of challenges involved. These range from blood collection and processing, to ensuring that assays are designed to take into account cell sample limitations and natural assay limits for rare responses. We can assist you from the very early planning stages to the assessment and interpretation of results. As part of this we can work closely with third party cell collection and processing sites to establish cohesive protocols. Where multiple sites collect blood and isolate PBMC’s, it is essential that they use consistent techniques and process cells in a timely manner. Crucial aspects, such as cell processing, freezing and shipping procedures, can be qualified in pilot assessments prior to the initiation of the main study. To find out more about our rapid, responsive and flexible service, contact our Ph.D. Immunologist customer service team today. 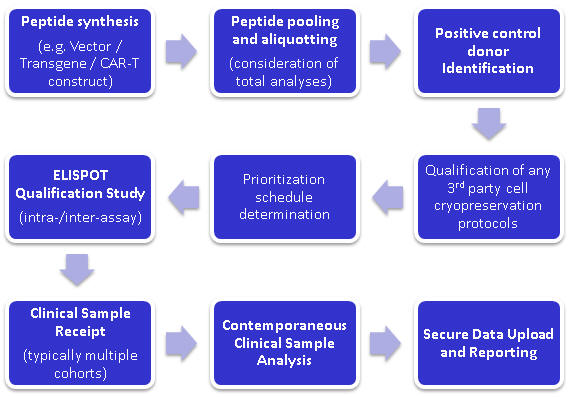
Fig 1. Example ELISpot project workflow for immune monitoring in clinical gene or immuno-therapy programs Request a Quote Key Publication: Geletneky K. et al., Oncolytic H-1 parvovirus shows safety and signs of immunogenic activity in a fist phase I/IIa Glioblastoma trial. Molecular Therapy (2017) https://doi.org/10.1016/j.ymthe.2017.08.016 
Fig2. Data from ELISpot assays carried out by ProImmune. Evaluation of T Cell Responses to H-1PV and Glioma Antigens by IFN-γ ELISpot Assay. (A and B) Cellular immune responses are shown for two patients treated with ParvOryx via (A) the intratumoral and intracerebral route (patient 2-04) or (B) the intravenous and intracerebral route (patient 5-14). PBMCs were isolated at the indicated days prior to (day 0) or after (days 10–120) treatment. After incubation with appropriate stimulants, IFN-γ-producing spot-forming cells (SFCs) were counted. The test stimulants were viral or glioma peptides (Table S3) or full-length viral proteins (NS1 or empty capsids made of VP1 and VP2). Phytohemagglutinin (PHA) and cytomegalovirus, Epstein-Barr virus, and influenza virus (CEF) peptide pools served as positive control stimulants. Negative control values (unstimulated cells) ranged from 0 to 21 SFCs per million PBMCs and were subtracted from the corresponding stimulated sample values. Means (columns) and SEMs (bars) of triplicate measurements are shown. Asterisks denote statistical significance (*p ≤ 0.05; mean SFC − 2 SEMs > 2× negative control). ELISpot Assay Service Features · Help with assay design, including sample collection, processing and shipping · IFN gamma, IL-2, 4, 10, 13, 17, Granzyme B · Other cytokines available on request · Detection of CD8+ and CD4+ T cell responses on frozen unmodified PBMC · Detection of CD4+ T cell responses on frozen PBMC depleted of CD8+ T cells after thawing · HLA tissue typing of donor samples as required · Full service peptide synthesis where required for the project · Reports delivered via secure web-server · Project follow-up consultation with technical specialist · ELISpot assay validation report available on request · Experience with sample shipping in the context of international multi-center clinical trials Request a Quote The Statistics of ELISpot: You may think of Shot Noise as a concept from quantum physics. In fact it is a limiting factor in cellular assays. Where such assays measure responding cells they can only do so in integer increments. For example if you are looking for a one in a million cells responding and an assay that measures e.g. 250,000 cells per condition will only have a one in four occurrence of a single response. These limitations dictate the limit of assay variance that can actually be achieved, based on the assay setup. So the question is: How close can we get to this limit? 
Fig 3. The CV achieved by ProImmune is close to the statistical CV driven by shot noise alone. Graph showing theoretical ‘shot noise’ based CV compared to the CV values achieved in ProImmune’s IFN gamma ELISpot inter assay comparison. SFC = Spot Forming Cells. Further key publication Cerullo, P. et. al. (2010). Oncolytic adenovirus coding for granulocyte macrophage colony-stimulating factor induces antitumoral immunity in cancer patients. Cancer Research. 70: 4297-4309. [PubMedID: 20484030] T Cell ELISpot at ProImmune B cell ELISpot at ProImmune |